How Dirty Solar Panels Cut Your Florida Energy Output
Dirty solar panels can lose 15-25% of output. Here's the math on SWFL pollen, salt, and bird droppings.
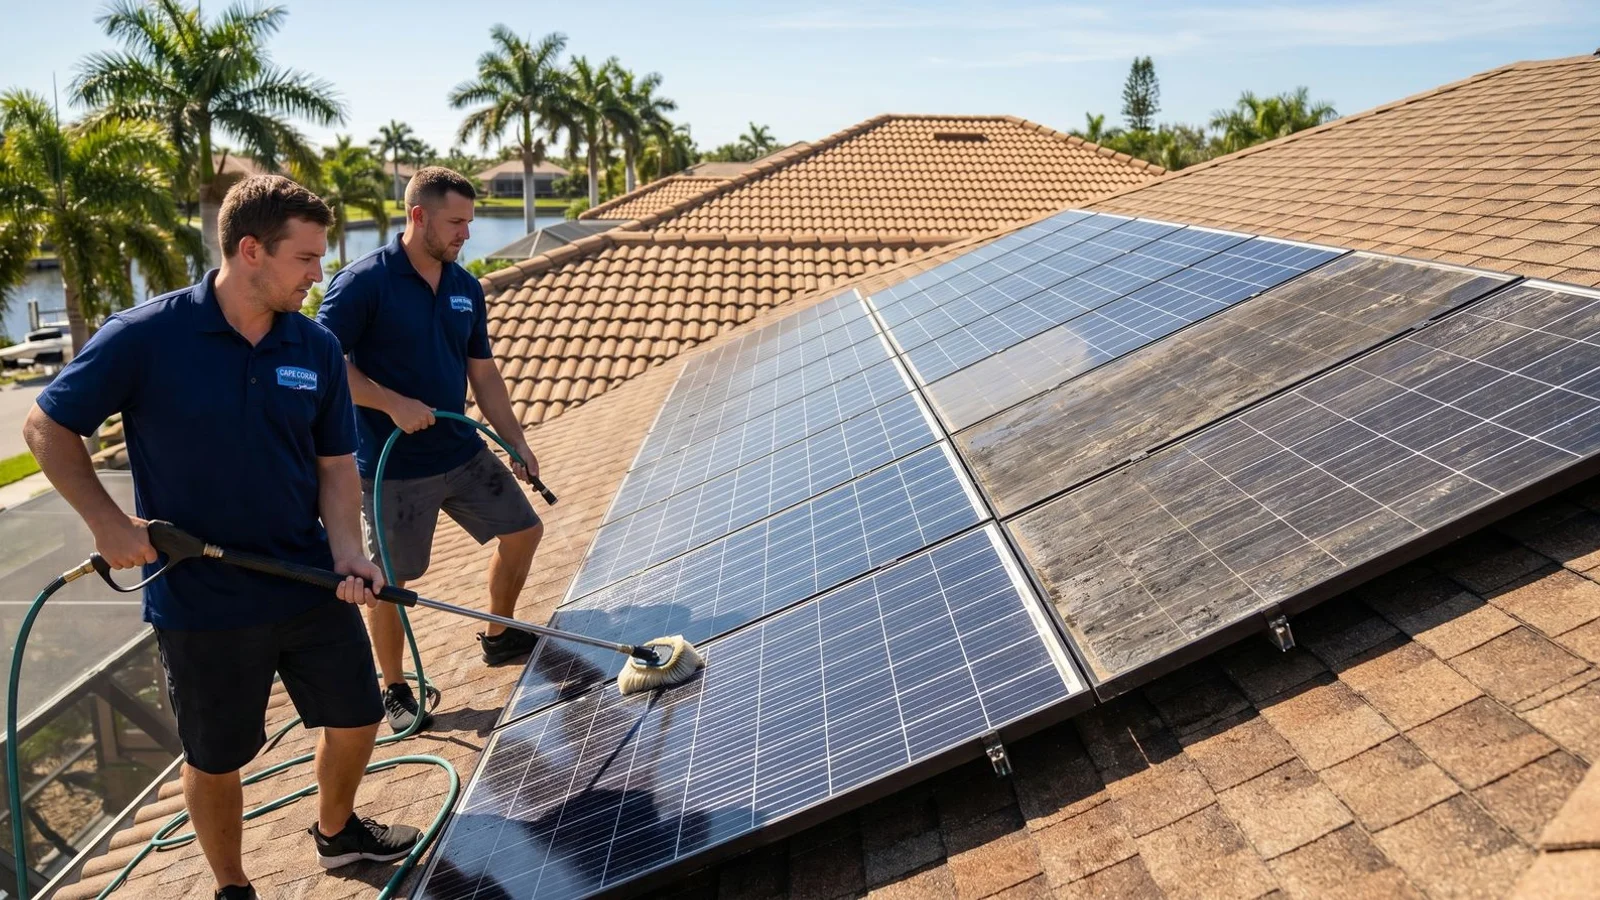
Our team constantly fields calls from Southwest Florida homeowners who think their solar inverters are failing. A sudden 15% drop in output often triggers panic about expensive equipment repairs. We usually find the real culprit is just a thick layer of local dirt and pollen.
This invisible buildup quietly drains your daily energy production.
We have tracked a documented 15% to 25% output loss across multiple Cape Coral solar installations. The math on this dirty solar panels energy loss adds up quickly over a few months.
We know most homeowners do not realize the financial impact until they wash the panels and watch the numbers climb. Let us look at the data behind these losses and outline a practical plan to restore your energy savings.
The 15-25% Number
We track output numbers closely across Southwest Florida. The National Renewable Energy Laboratory (NREL) notes that modern panels only degrade naturally by 0.5% to 0.75% per year. Our team relies on this baseline to prove that larger drops are entirely due to environmental soiling. A 2025 solar testing report confirms that high humidity mixed with dust easily triggers a 20% solar panel efficiency loss. We see this exact scenario play out constantly across different local microclimates.
Here is the documented output loss range for our region:
- Inland Cape Coral homes: 12% to 20% output loss between cleanings.
- Coastal homes (Fort Myers Beach, Sanibel, Marco): 18% to 28% output loss.
- Tree-shaded properties: Higher end of the range due to pollen and bird droppings.
- Industrial-adjacent properties: Higher end due to particulate from construction.
What Causes Solar Soiling in SWFL
We face three primary sources of contamination unique to the Southwest Florida climate. Each of these elements creates a specific challenge for your rooftop array.
Coastal Pollen
We battle massive amounts of pollen during the long Florida spring. Live oaks and slash pines release millions of sticky yellow grains from February through May. Our crews find that this pollen forms a stubborn film on tempered solar glass. Rainwater alone fails to wash this away because the organic resin bonds tightly to the hot surface. We highly recommend using a soft brush to physically lift this specific type of regional grime.
Salt-Air Dust
Our coastal environment pushes salt aerosol particles up to five miles inland on the sea breeze. This salt is highly hygroscopic, meaning it actively attracts moisture straight out of the humid morning air. We watch this daily cycle turn dry dust into a thick paste that builds up over several months. The resulting layer acts like a shade cloth directly over your photovoltaic cells. We tell property owners that ignoring this salt layer will severely limit their energy generation.
Bird Droppings
Our technicians often encounter severe panel damage caused by local seagull and pigeon populations. Bird droppings contain highly corrosive uric acid that can permanently etch the anti-reflective coating on your panels. We know that a single large dropping creates a severe hotspot by forcing a shaded cell to act as a resistor. This resistance converts energy into intense heat instead of electricity, causing several issues:
- Localized cell failure.
- Melted backsheets over time.
- Voided manufacturer warranties.
We urge homeowners near the water or thick tree canopies to handle bird messes quickly.
Volcanic and Wildfire Particulate
Our summer skies frequently host the Saharan Air Layer, a massive dust cloud tracked by NOAA. This fine particulate travels 5,000 miles across the Atlantic Ocean and peaks between late June and August. We see this reddish-brown dust settle over entire neighborhoods after a light afternoon rain. The tiny particles accumulate in the lower corners of your panels and create a permanent ledge of dirt. We advise a thorough rinse after these major seasonal dust events clear out.
The Real Cost of Lost Production
We want to highlight the direct financial hit of ignoring dirty panels. Local utility rates from providers like FPL and LCEC hover around 16 cents per kilowatt-hour in 2026. Our calculations show that a dirty system forces you to buy expensive grid power to make up the difference. A simple before-and-after comparison reveals exactly how much money you leave on the roof. We see these numbers translate into hundreds of dollars lost annually.
Let us run the math for a typical 8 kW Cape Coral solar installation:
- Annual production at 100%: ~12,000 kWh
- Annual production with 20% loss: ~9,600 kWh
- Annual production loss: 2,400 kWh
- Value at $0.16/kWh: $384 lost per year
Our commercial clients with larger 12 kW systems easily lose over $570 each year. A professional, twice-yearly cleaning runs between $400 and $700 total. We find that this maintenance effectively pays for itself within 12 months by recovering that lost power, maximizing your solar panel cleaning savings.
Why Pressure Washing Solar Panels Is Wrong
We frequently see well-meaning homeowners destroy their systems using high-powered pressure washers. Standard panels are built to withstand natural rain, not a direct 2,000 PSI blast from a pressure wand. Our team warns that this intense force easily pushes water past the aluminum frame seals and straight into the delicate electrical layer. This critical mistake causes immediate cell delamination and permanent corrosion. We always remind clients that this exact action will void their equipment guarantees.
Major manufacturers like Enphase, Qcells, and SunPower explicitly state that abrasive chemicals or pressure washing will cancel their 25-year warranties. Our correct and safe method requires a non-abrasive soft-bristle brush combined with a purified, deionized water rinse. You can review our Solar Panel Cleaning service for a full breakdown of this warranty-safe approach. We believe protecting your investment requires the right tools and a gentle touch.
The Documented Restoration Pattern
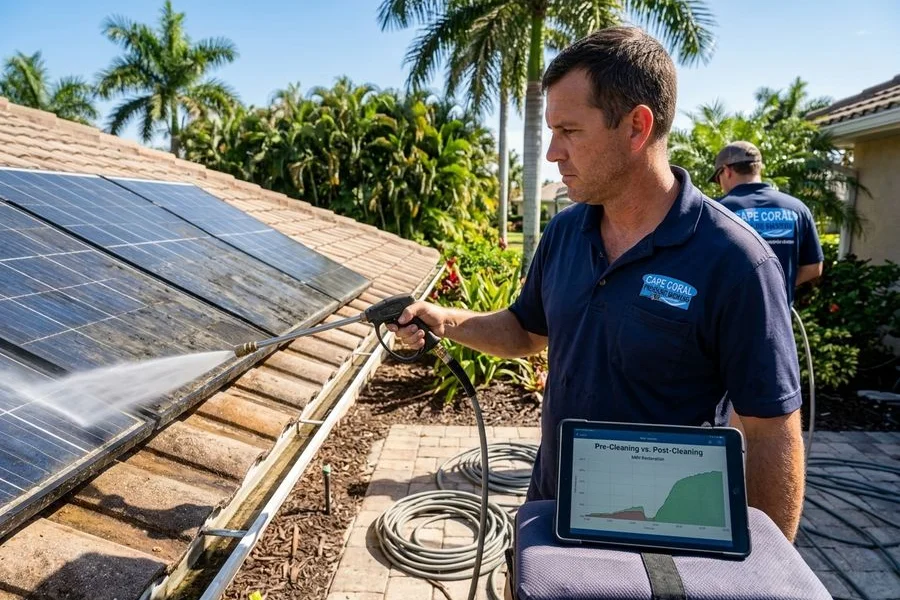
We love showing clients the immediate results of a proper cleaning session. You can track this exact restoration pattern right on your smartphone using monitoring software like Enphase Enlighten or SolarEdge. Our customers typically see a literal step-function recovery line appear on their production graph the very next day. The visual proof makes this one of the most satisfying home services available. We outline the standard recovery timeline below.
| Cleaning Timeline | Observed Production Change |
|---|---|
| Day 1 (Clean Day) | Brief downtime or shadow interference during the active washing process. |
| Days 2 to 7 | Output metrics climb rapidly back up to the original baseline efficiency. |
| Day 7 and Beyond | Sustained 15% to 25% production increase compared to the pre-clean data. |
This exact performance boost is measured by our technicians on nearly every job. We know it proves that regular cleaning works.
SWFL-Specific Cleaning Frequency
We customize our maintenance schedules to match the specific microclimates found around the Gulf Coast. Properties sitting near thick preserves or coastal inlets face a much heavier barrage of contaminants. Our experience shows that a generic annual wash simply fails to keep up with Florida weather. You need a targeted approach to maintain maximum panel efficiency. We suggest adopting the following professional cadence.
- Inland Cape Coral: Wash twice yearly to handle post-pollen and post-rainy season buildup.
- Coastal Homes: Wash three times yearly to fight salt spray, sticky pollen, and post-storm debris.
- Tree-Canopied Properties: Wash twice yearly and schedule immediate spot cleanings after heavy bird activity.
- Commercial Installations: Wash quarterly to maximize the massive financial return on large-scale arrays.
You can read more about this topic extensively in our dedicated guide on How Often to Clean Solar Panels for a thorough breakdown of regional scheduling. We know that following these guidelines ensures your system runs at peak capacity year-round.
How to Verify Output Loss
We encourage every solar owner to perform a quick self-audit a few times a year. You do not need special tools to spot a serious drop in efficiency. Our experts use three proven methods to confirm exactly how much power a dirty system is bleeding. Anyone can easily perform these checks from a kitchen table or driveway. We recommend starting with your digital tracking app.
- Monitor app comparison: Compare your current weekly production against the exact same week from last year, assuming similar weather conditions.
- Visual inspection: Look for a hazy yellow film, white chalky spots, or heavy bird droppings that clearly indicate severe soiling.
- Power bill comparison: Check your current utility bill against the same month last year after accounting for any new appliances.
A 15% year-over-year production drop with no equipment changes is our standard rule of thumb to identify dirty glass. We know this simple check takes just a few minutes and saves you hundreds of dollars.
Get a Solar Cleaning Quote
We make it incredibly easy to protect your renewable energy investment. If you manage an array in Cape Coral or anywhere across Southwest Florida, simply request a free quote to get started. Our team can often provide an accurate estimate sight-unseen by reviewing your panel count and basic roof access via satellite imagery. You can visit our Solar Panel Cleaning page to learn more about our completely warranty-safe methods. We guarantee clean panels will result in a better performing system. Lower your power bills and take action today.
Related Service
Solar Panel Cleaning →Non-abrasive soft-bristle cleaning with deionized water rinse, restoring solar panel output without scratching tempered glass or voiding warranties.